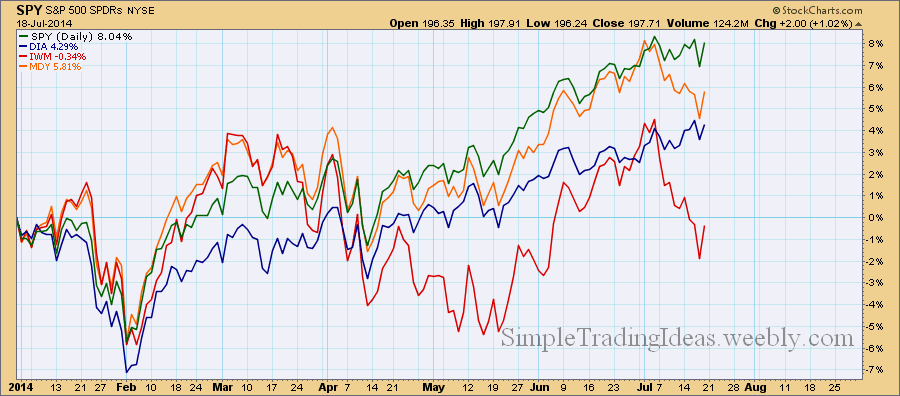
The performance chart below compares four ETFs representing the Mega-Caps, Large-Caps, Mid-Caps and Small-Caps. Large-Caps are the best and the Meg-Caps are trying to catch up. On the other hand Small-Caps are not doing so good.
| Simple Trading Ideas |
|
|
The performance chart below compares four ETFs representing the Mega-Caps, Large-Caps, Mid-Caps and Small-Caps. Large-Caps are the best and the Meg-Caps are trying to catch up. On the other hand Small-Caps are not doing so good.
0 Comments
The daily chart below shows IWM, the Russell 2000 iShares, representing the small caps. As you notice the price closed below the 50-day SMA. The indicator window shows the Aroon trend indicator with Aroon Down (red) moving up to almost 100. Below that you can see the price relative to the S&P 500. Small caps are underperforming large caps. 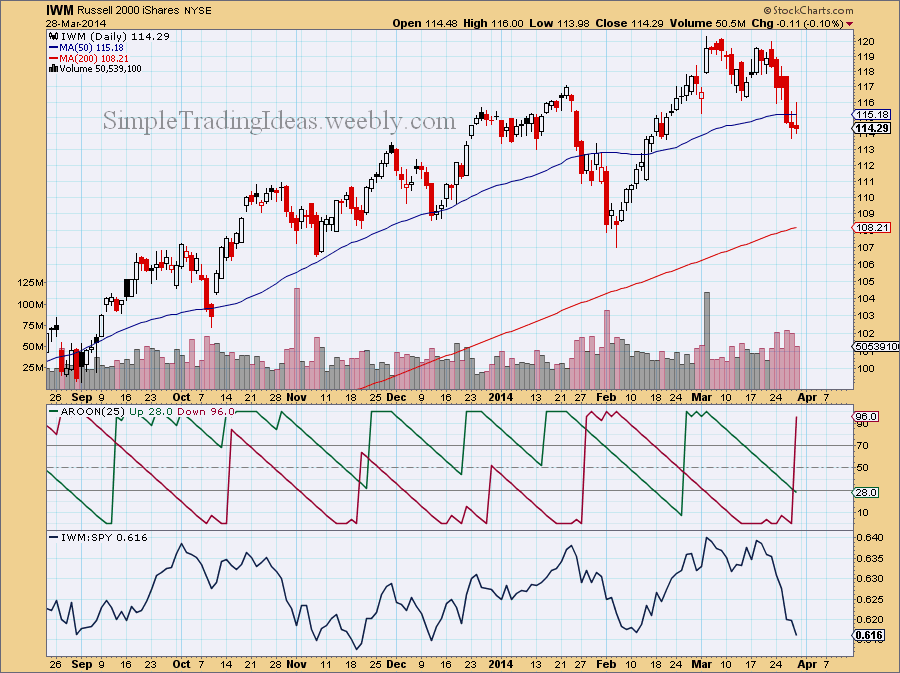 IWM the Russel 2000 iShares is representing the small-caps. Although it holds up better than large-caps as I mentioned in previous posts it is losing momentum. Notice on the chart below that it failed to reach the upper channel before starting to trade sideways and MACD crossed below the signal line. 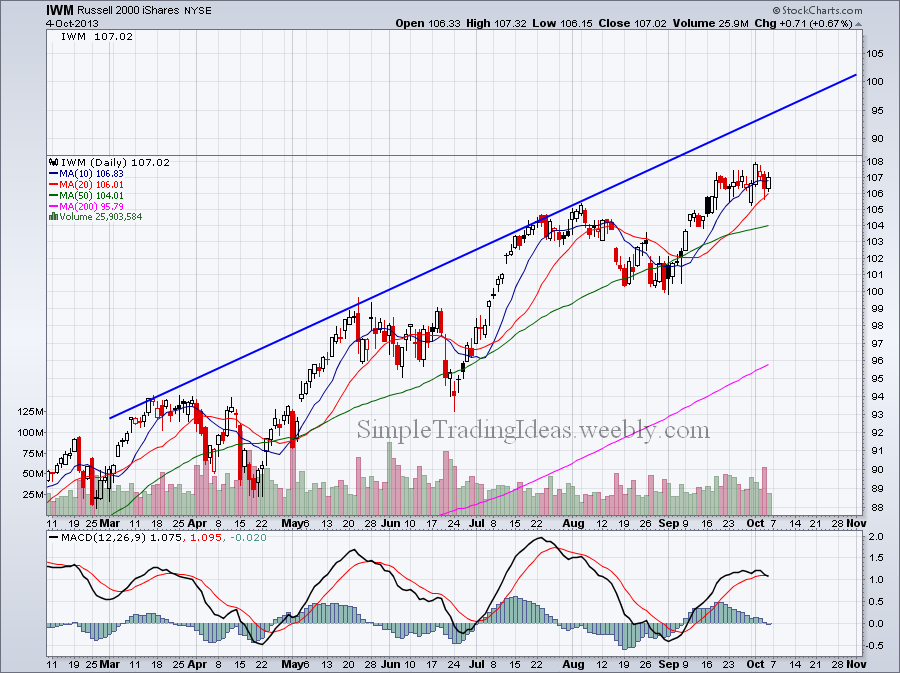
The chart below compares the performance of small-caps (IWM), mid-caps (MDY), large-caps (SPY) and mega-caps (DIA) during the past three months. Small and mid-caps has been doing much better. 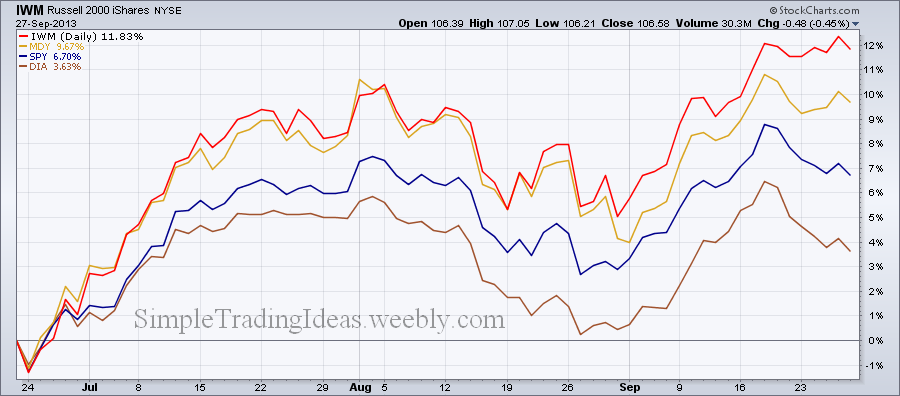
Below you can see the daily candlestick charts for DAI, SPY, IWM and QQQ. Click on Play or the Arrows to see the other charts. The chart below compares the Dow Jones Industrial Average (DIA) the S&P 500 (SPY) the Mid Caps (MDY) and the Small Caps (IWM). As you can see not all the segments of the market advanced during that time. Even the Large Caps didn't change much during the past 13 trading days. 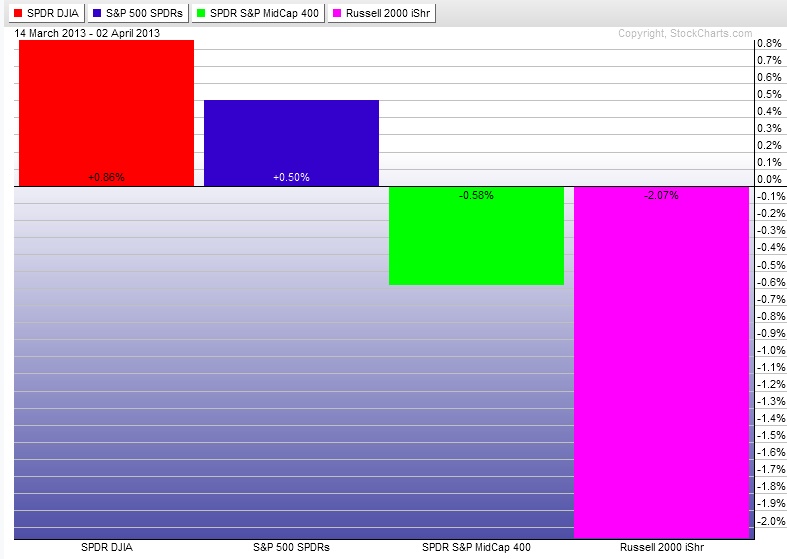
As the Market moved higher today I decided to compare the Large Caps (DIA) the S&P 500 (SPY) and the Small Caps (IWM). Normally I like it when the Small Caps are doing good and leading the Market. First let's look at the chart for SPY. Today's candle opened up with a gap moved up and back down creating a larger upper shadow. This candle looks like a shooting star which is bearish. Also notice that the 10-day SMA crossed below the 20-day SMA and the price moved pretty far from the 10-day SMA which is sort of turning down. 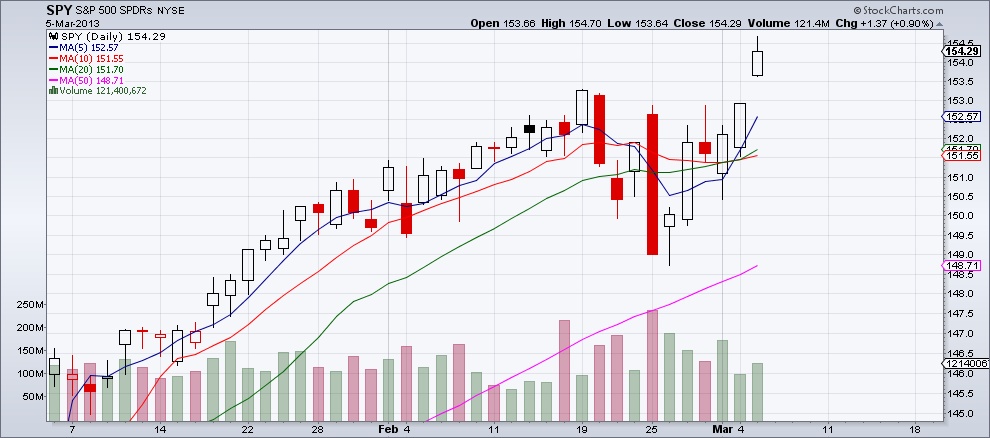
The chart for the Small Caps (IWM) shows more weakness. The 10-day SMA is definitely turning down. 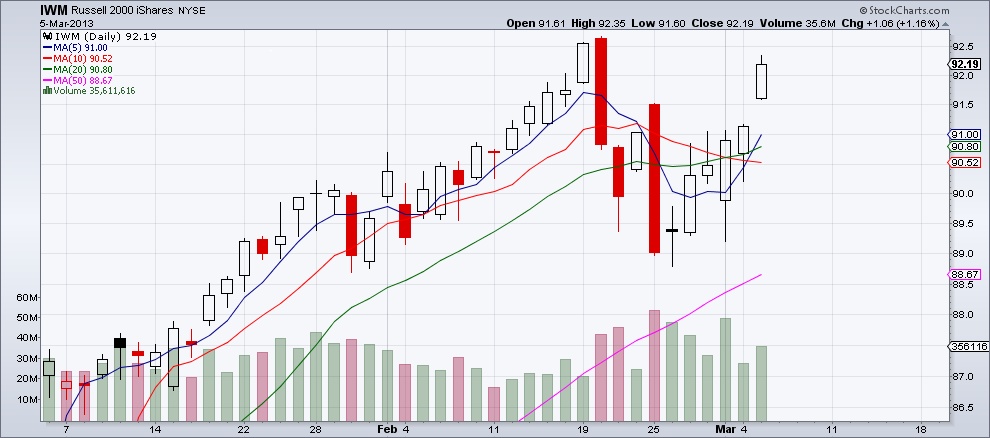
There is no question about it, out of the three the Large Caps are the best 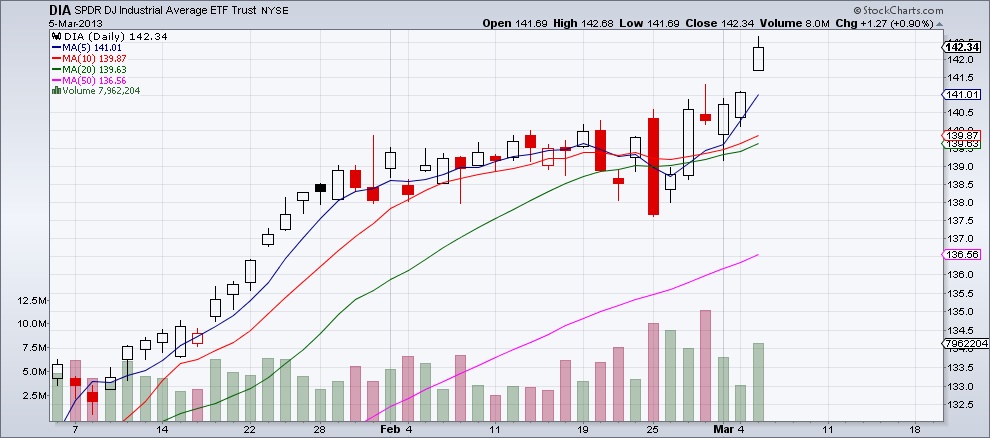
|
Loading
Search Site
Links
Archives
September 2014
Categories
All

|
 RSS Feed
